How to Debug and Monitor Webhooks
Troubleshoot webhook delivery issues, monitor webhook history, and maintain reliable webhook integrations.
Problem
Your webhook integration is experiencing delivery failures, missed events, or other issues that require troubleshooting and ongoing monitoring.
Prerequisites
- Active webhook subscription (see How to Set Up Webhook Notifications)
- Access to PandaDoc Developer Dashboard
- Access to your webhook endpoint logs
Common Problems and Solutions
Problem: Webhooks Not Being Delivered
Symptoms: No webhook events appear in your application logs, but events are occurring in PandaDoc.
Solution:
-
Check webhook history:
- Navigate to Webhooks History tab
- Verify delivery attempts are being made
- Check HTTP response codes
-
Verify webhook subscription:
- Confirm subscription is active (not deactivated)
- Check the endpoint URL is correct
- Verify events are configured for the subscription
-
Test endpoint accessibility:
- Ensure endpoint uses HTTPS (required)
- Test endpoint responds to POST requests
- Verify firewall allows incoming HTTPS requests
Problem: Webhooks Failing with HTTP Errors
Symptoms: Webhook history shows 4xx or 5xx error responses.
Solution:
-
For 4xx errors (client errors):
- Check your endpoint returns HTTP 200 for successful processing
- Verify endpoint can handle JSON array payloads
- Ensure endpoint processes requests within 20 seconds
-
For 5xx errors (server errors):
- Check your server logs for application errors
- Verify adequate server resources (CPU, memory)
- Test endpoint with sample webhook payload
-
For timeout errors:
- Optimize endpoint response time (must respond within 20 seconds)
- Acknowledge (respond to webhook) webhook immediately, process asynchronously
- Check for database connection issues
Problem: Webhook Subscription Deactivated
Symptoms: Webhook subscription shows as inactive in Developer Dashboard.
Solution:
-
Understand deactivation triggers:
- 7 days of continuous 4xx/5xx errors without successful responses
- HTTP 410 response immediately deactivates webhook
-
Reactivate webhook:
- Fix underlying endpoint issues first
- Update webhook subscription settings
- Monitor delivery success after reactivation
-
Prevent future deactivation:
- Implement proper error handling
- Set up monitoring and alerting
- Test webhook endpoint regularly
Problem: Need to Manually Retry Failed Webhooks
Symptoms: Automatic retries exhausted, webhook delivery marked as failed.
Solution:
-
Access webhook history:
- Navigate to Webhooks History tab
- Locate failed webhook delivery
-
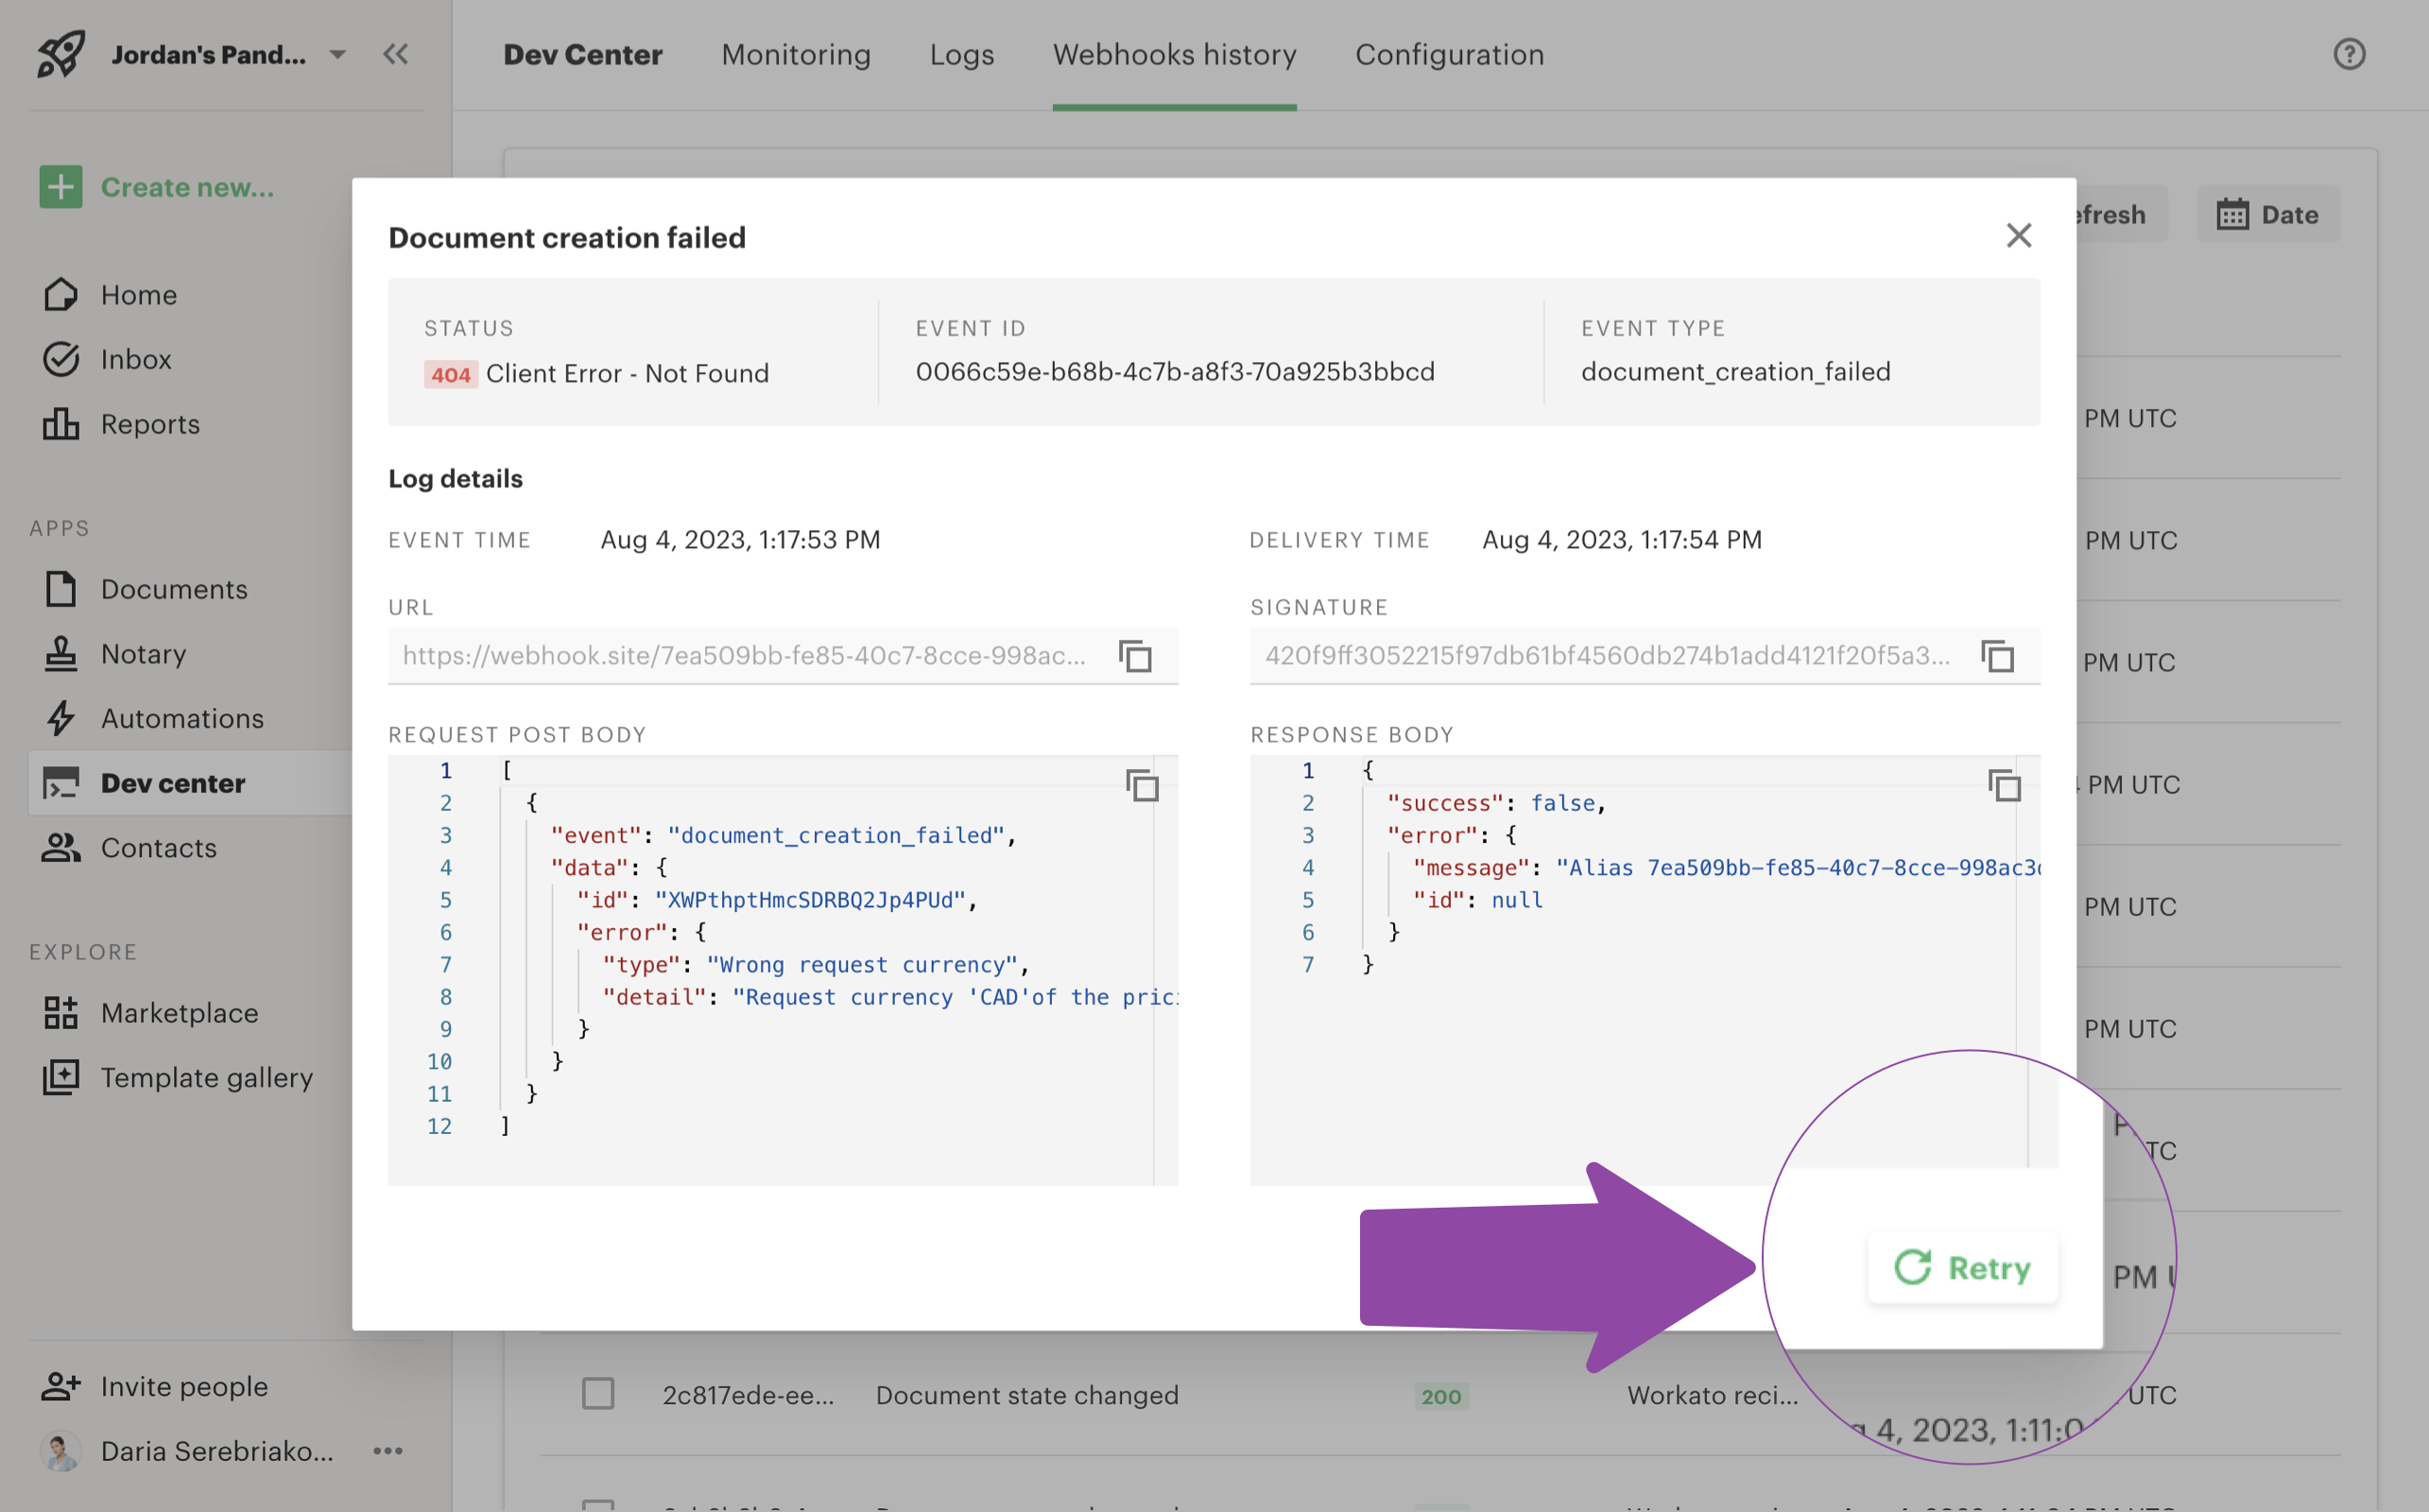
Retry failed delivery:
- Click "Retry" button next to failed delivery
- Monitor retry attempt in delivery history

Webhook manual retries
- If retry fails again:
- Check endpoint logs for specific error details
- Verify endpoint can handle the specific event payload
- Consider implementing fallback polling for missed events
Problem: Missing Webhook Events
Symptoms: Some events are being delivered, but specific events are missing.
Solution:
-
Check event configuration:
- Verify correct events are selected in webhook subscription
- Confirm events are actually occurring in PandaDoc
-
Review webhook history:
- Check if events were sent but failed delivery
- Look for patterns in successful vs failed events
-
Implement event tracking:
- Log all received webhook events
- Compare with expected events from business logic
- Use webhook history to identify gaps
Problem: Missing or Empty Recipient Shared Links
Symptoms: The shared_link field in webhook payloads is sometimes empty or missing, even when recipients have access to the document.
Solution:
-
Understand the root cause:
- Webhook processing is asynchronous and may deliver before shared links are fully generated
- This is expected behavior due to the timing of webhook delivery vs. link generation
-
Implement fallback logic:
- Always check if
shared_linkis present and not empty before using it - Use the Document Details endpoint as a fallback when shared_link is missing
- Always check if
-
Best practices:
- Always validate
shared_linkpresence before use - Cache Document Details responses to minimize API calls
- Always validate
Problem: Connection Errors
Symptoms: Webhooks show "External Error - Connection Error" in logs, with Java exceptions like java.io.IOException: HTTP/1.1 header parser received no bytes and java.io.EOFException: EOF reached while reading.
Solution:
-
Understand connection closure issues:
- Remote server closes connection immediately after receiving request
- No HTTP response sent back to PandaDoc
- Usually indicates server-side problems or network issues
-
Investigate root causes:
- Server overload: Check if your endpoint is experiencing high load
- Network issues: Verify network stability between PandaDoc and your server
- Rate limiting: Check if your server is rejecting connections due to rate limits
- Firewall/proxy: Ensure intermediate network devices aren't dropping connections
-
Resolve connection issues:
- Monitor your server's availability and response patterns
- Check server logs for errors or connection resets
- Verify adequate server resources (CPU, memory, network)
- Test endpoint stability under load
-
Temporary workarounds:
- Implement fallback polling if webhooks continue failing
Problem: Webhook Performance Issues
Symptoms: Slow webhook processing, timeout errors, or high server load.
Solution:
-
Optimize endpoint response time:
- Acknowledge webhook immediately (return HTTP 200)
- Process webhook payload asynchronously
- Use database transactions for consistency
-
Monitor webhook load:
- Track webhook frequency and volume
- Monitor server resources during peak webhook delivery
- Set up alerts for high error rates
-
Implement proper error handling:
- Return appropriate HTTP status codes
- Log errors with sufficient detail for debugging
Monitoring and Maintenance
Access Webhook History
To monitor webhook delivery:
- Navigate to Webhooks History tab
- Review delivery logs showing:
- Event timestamps
- HTTP response codes
- Delivery status (success/failure)
- Error messages
- Retry attempts
Related
- How to Set Up Webhook Notifications - Initial webhook configuration
- How to Verify Webhook Authenticity - Security implementation
- Webhook Events Reference - Technical specifications
- Understanding Webhooks - Concepts and architecture
Updated 3 days ago
